
Net Zero Feasibility Study
This exercise takes you through three key environmental analysis steps that accompany the beginning of any net zero building project: (A) Analyze the local climate, (B) quantify on-site renewable generation potential and (C) benchmark your building’s target energy use against that of existing buildings of comparable size and location. The exercise helps you to discover climatic challenges and opportunities and gain a first understanding of whether onsite net zero energy use seems realistic for your project.
Task A Climate Analysis
Go through the project brief (see Multi Unit Residential and Medium office/startup examples), select a site and conduct an analysis of the surrounding microclimate. The purpose of this exercise is to identify up to three climate-specific aspects that you may want to exploit in your building’s environmental concept going forward such as seasonal access to wind, substantial solar radiation levels during cold winter days or high diurnal temperature swings. Complement your analysis with a direct shading study of your site and provide an initial massing for your building. A “massing” is a simplified representation of the envelope of a building that should have the floor area specified in the project brief (see Figure 1). Note that for multi-story buildings the floor area is different from the building footprint, i.e. the area of the building that touches the ground. Do not worry about “locking yourself in” with this massing design. The proposed massing should just give you a sense of scale, i.e. how much space will the building take up on the site? How much exposed roof and façade area is available for photovoltaics (Task B)?
For the shading analysis, you need to a neighborhood massing model in Rhino that includes the boundaries of your site as well as key neighboring buildings and landscape that seasonally overshadow your site. Neighborhood massing models may be available from the local municipality, e.g. the Boston Planning & Development Agency, or you can build a model form scratch using GIS shapefiles and/or a combination of Google maps and Street View to determine the heights of nearby objects. Another good resource is CADMapper. Tip: The EnergyPlus-based PV potential calculation method that we will use for Task B can only model a limited number of surfaces. You should therefore only keep neighboring buildings in your model that shade you site during Winter solstice. Place neighboring buildings on a separate Rhino layer.
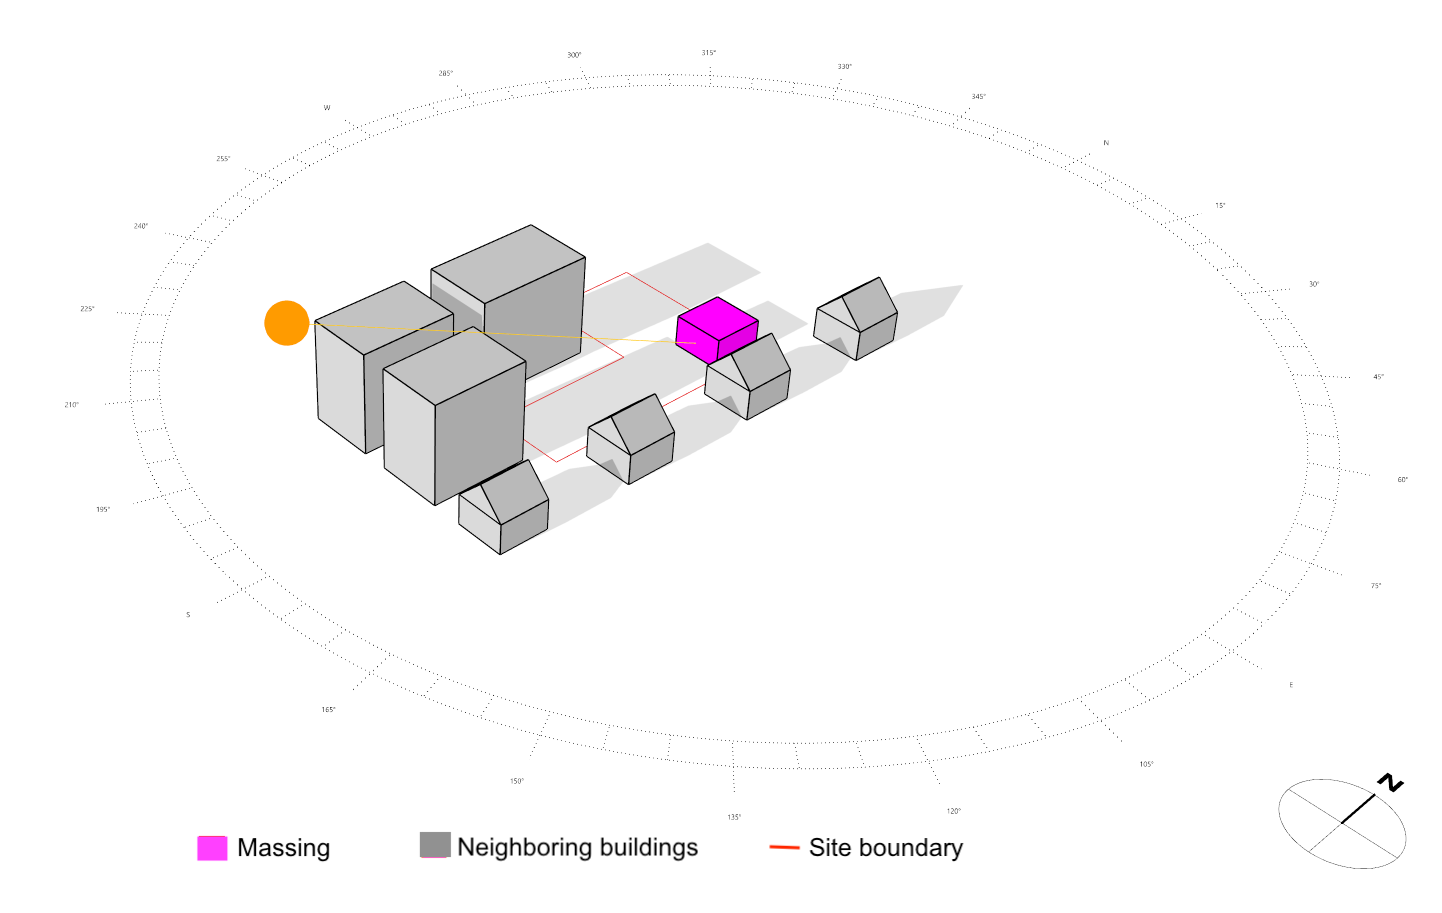
Figure 1: Example massing study for a 200 m2 single family home
Task B Onsite PV Potential
To estimate how much electricity you can generate on-site using Photovoltaics, initially run a radiation analysis of your building massing to identify which surfaces have the highest solar exposure. Figure 2 shows that the roof of the massing receives uniform radiation throughout the year and so solar panels can be placed anywhere on the roof.
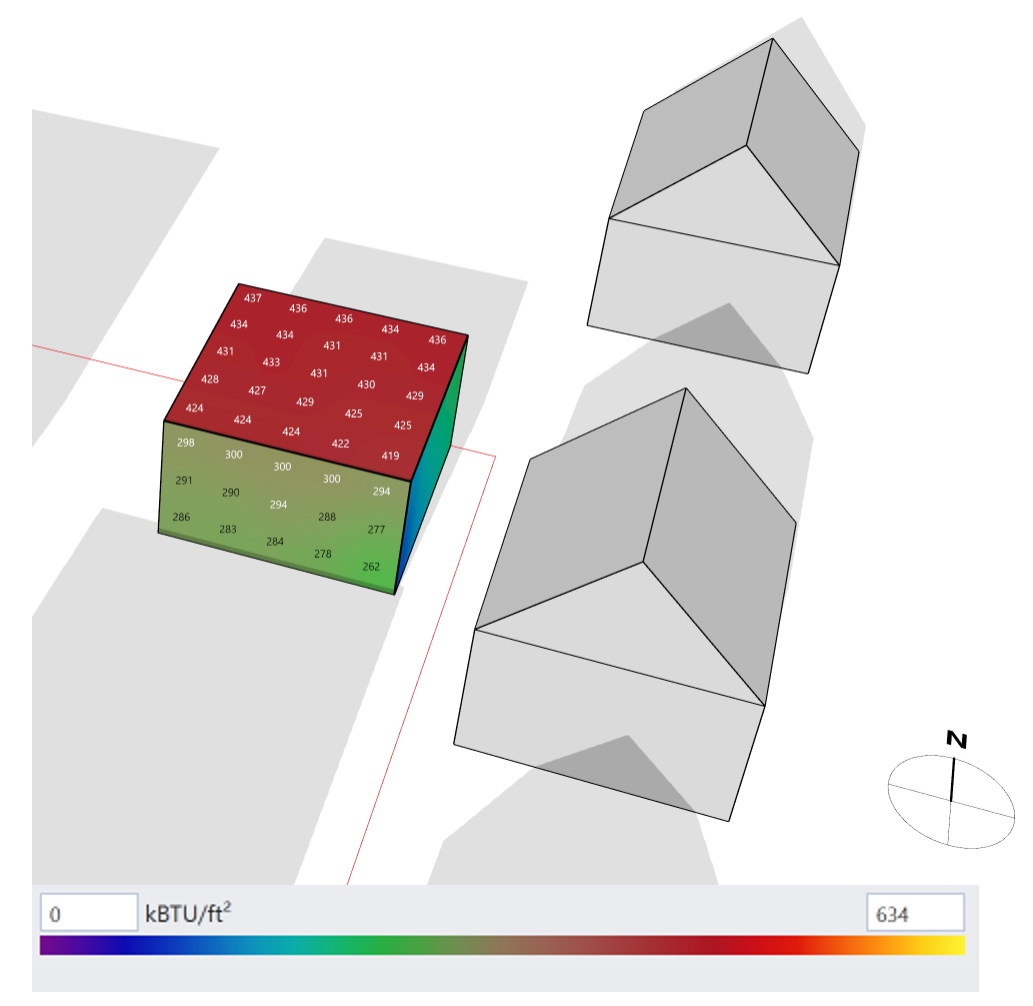
Figure 2: Radiation map analysis of a building massing
Add solar panels to your massing proposal. Individual panels should be about 1.0m x 1.5m in size and may be placed on the rooftop, integrated in the façade and/or double function as shading systems for a walkway or parking lot. Make sure that all panel are oriented correctly, i.e. facing the sun/sky. (Tip: The Rhino command “dir” allows you to visualize the orientation of one or multiple surfaces. The command “flip” adjusts the orientation, if necessary.) Once the panels have been placed, switch to the ClimateStudio ‘Thermal Analysis’ workflow and assign all surrounding objects as shading surfaces and all solar panel as PV (Figure 3). If parts of your massing shade the soalr panels, temperary make them a shading object as well. The suggested panel efficiency is 22% using the ‘simple’ model type. You may also explore actual products using the ‘one diode’ model.
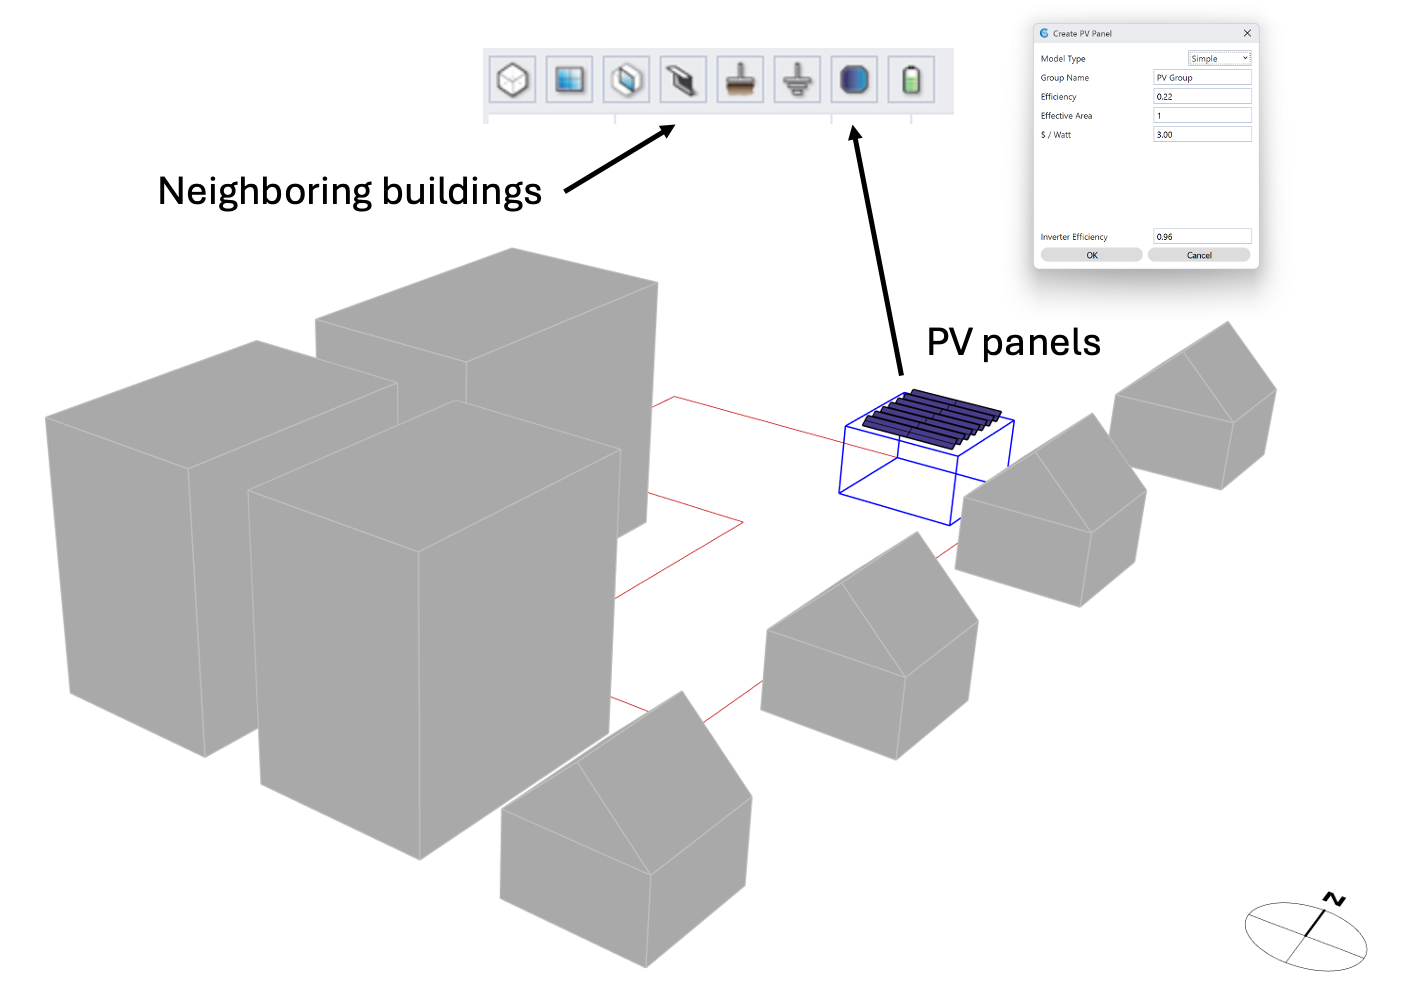
Figure 3: Thermal model with PV panels and neighboring buildings.
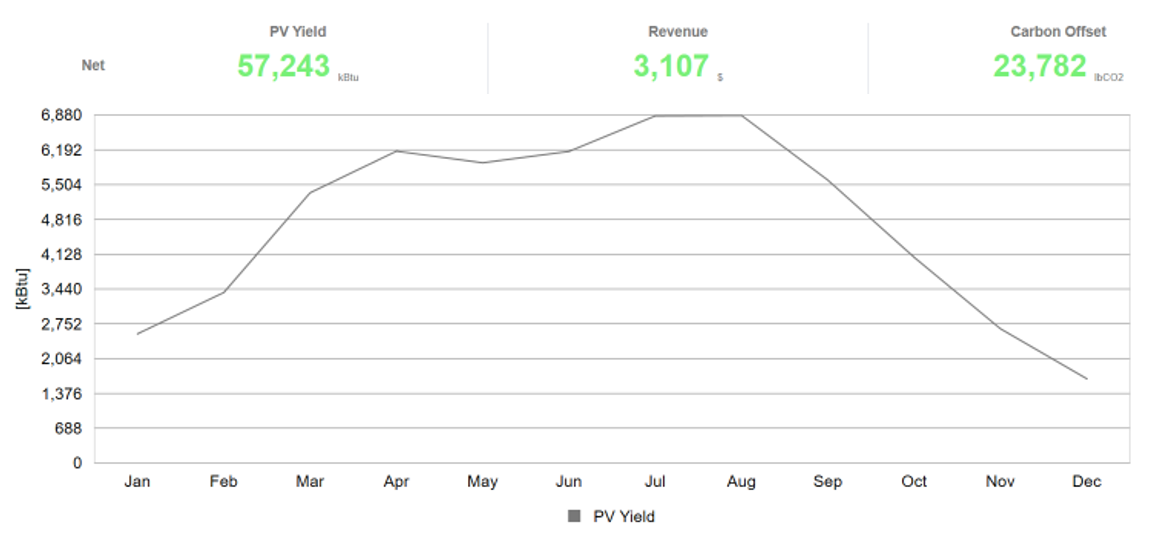
Run a thermal simulation and note down the resulting annual electricity yield.
Task C Energy Benchmarking using the Building Performance Database
Use the US Department of Energy’s Building Performance Database (BPD) to create a histogram of the on-site energy use intensities (EUI) of comparable buildings constructed between 2000 and 2025. Calculate the electricity yield per floor area that the PV system designed under Task B will provide and add it to the histogram. Pay attention to units! The example single family home from Figures 1-3 has a conditioned floor area of 2152 ft2 (200 m2). This means that the PV system can support an EUI up to 57,243kBTU/2152ft2 = 27kBTU/ft2. The histogram in Figure 5 shows that 102 out of 303 single family homes in Climate Zone 5A fall within that budget and could achieve net zero status.
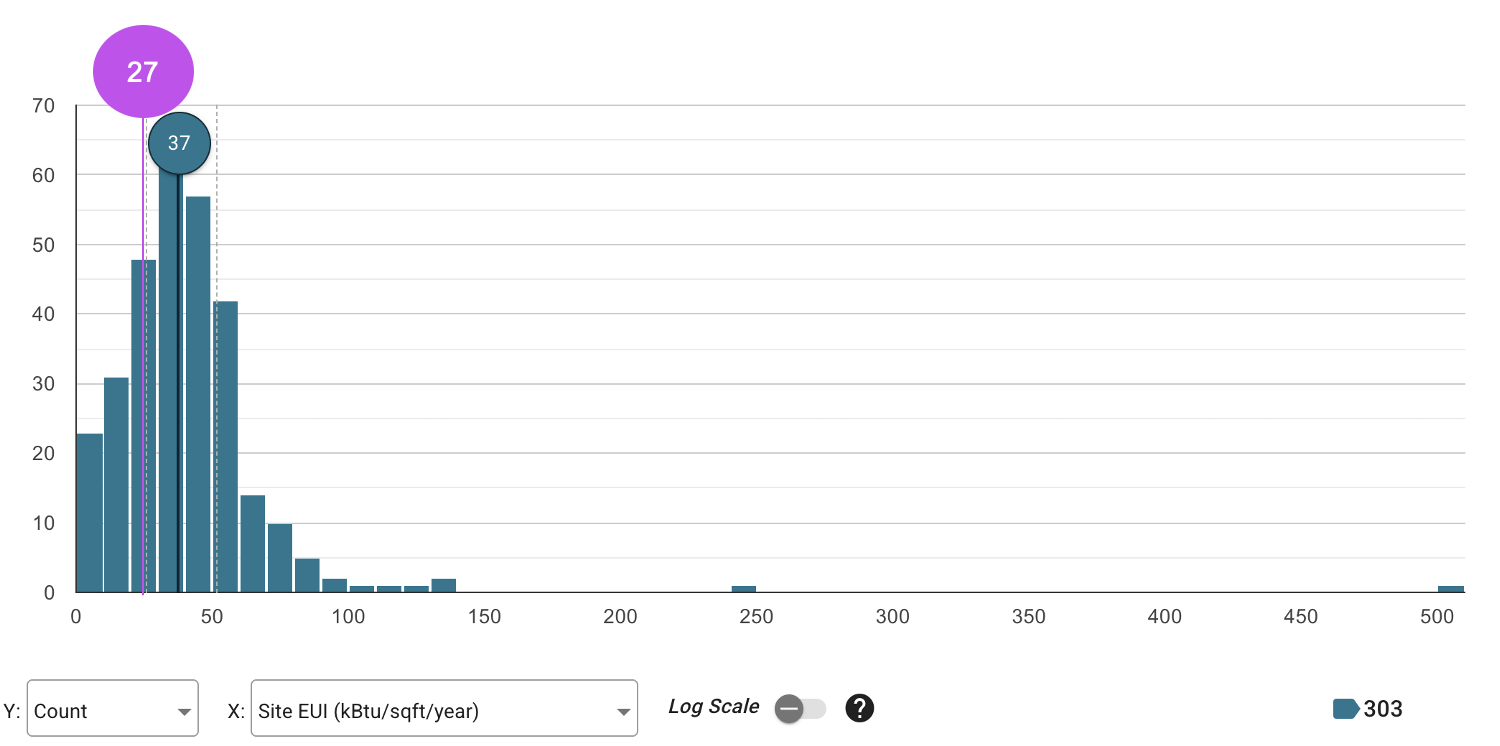
Figure 5: Histogram of EUIs of single family homes in Climate Zone 5A built between 2000 and 2025
Figure 4: Annual electricity yield of the PV system from Figure 3.
The results of this analysis offer solid initial estimates of the required energy use intensity of the buildings and its PV system size. For the assignment, please submit screenshots, similarly to Figure 1, 2, 3 and 5. (Make sure that the north arrow is visible in all figures.) Document key assumptions and provide an brief assessment of whether site net zero is a realistic target for your project.
Related Handbook Chapters
Daylighting Handbook II Chapter 9; Climate Driven Design Chapter 2